[Problem Set 3 Spike trains] Problem 2: Analysis of spike trains
Link of the iPython notebook for the code
AT2 – Neuromodeling: Problem set #3 SPIKE TRAINS
PROBLEM 2: Analysis of spike train
One records and analyses several spike trains from a single neuron in the primary somatosensory cortex of a monkey experiencing a vibratory stimulus on the fingertip, for different vibration frequencies $f_1 ∈ \lbrace 8.4, 12, 15.7, 19.6, 23.6, 25.9, 27.7, 35\rbrace \text{ Hz}$. The simulation is conducted between $200$ and $700$ msec.


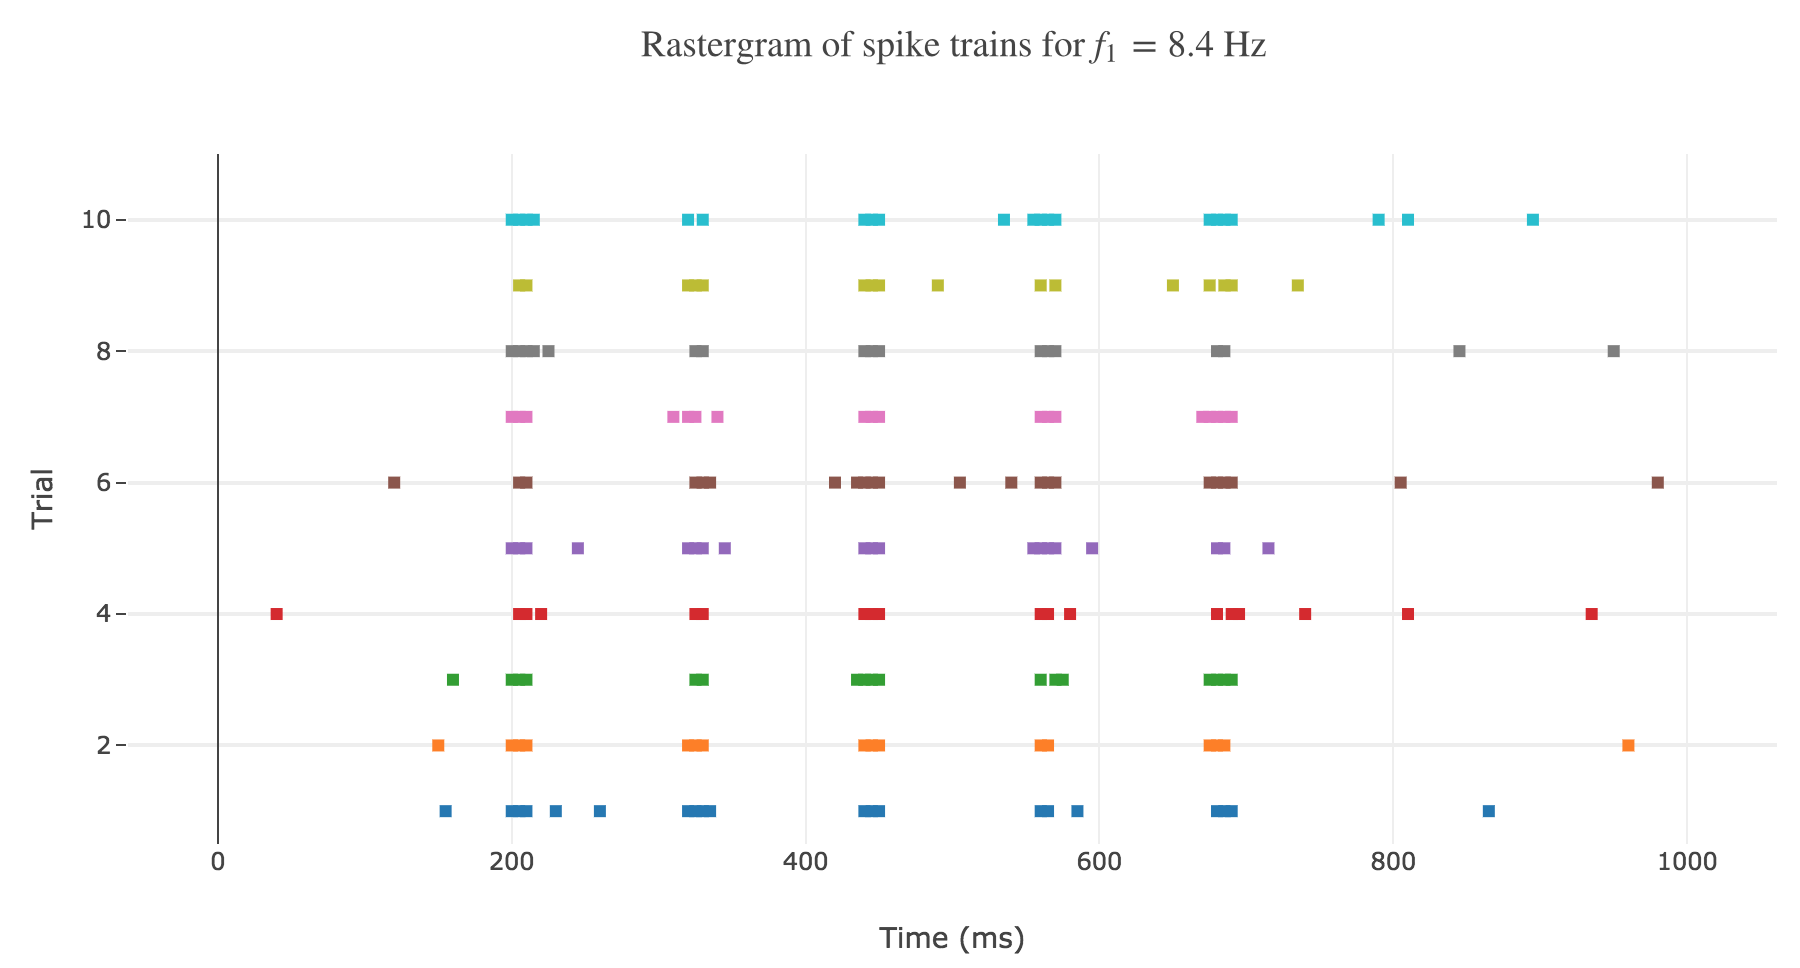
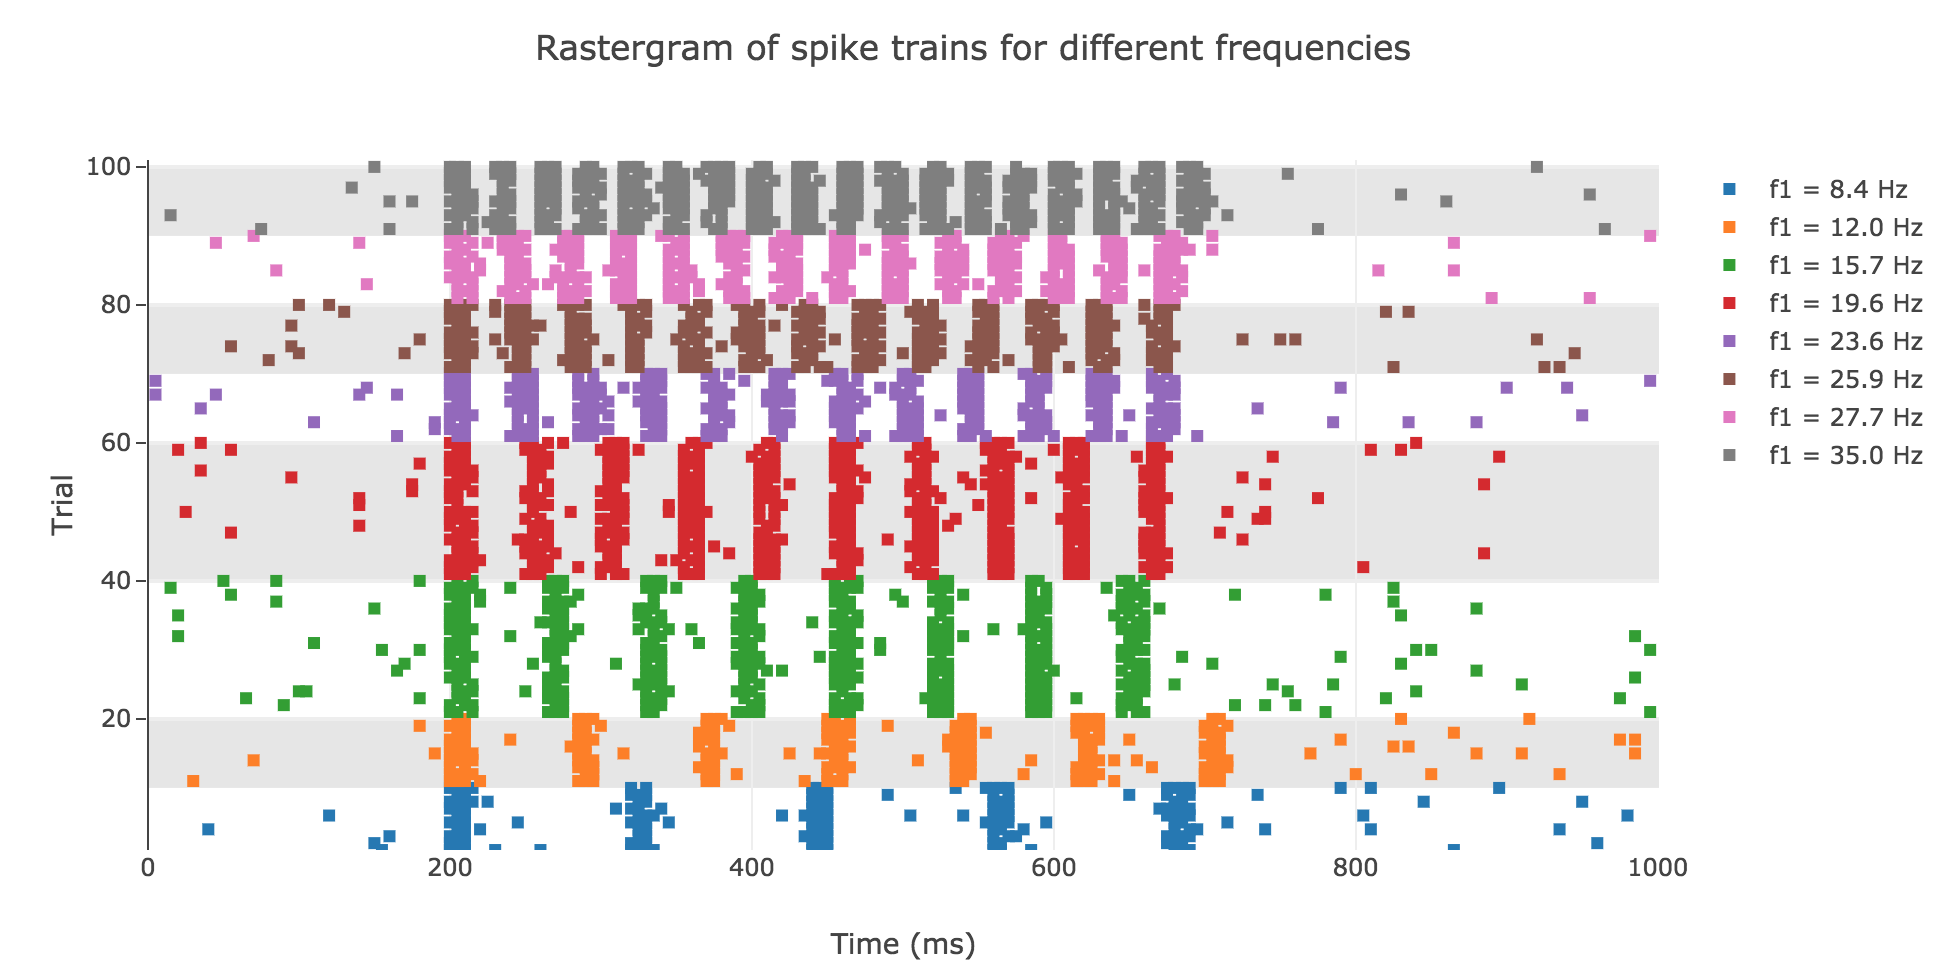
As shown in Figure a. and Figure b., the spikes within the simulation period (between $200$ and $700$ msec):
- seem to be periodically spaced for a given frequency $f_1$
- are more and more numerous as the frequency increases
and even more: the number of spikes seem to depend linearly on the vibration frequency.
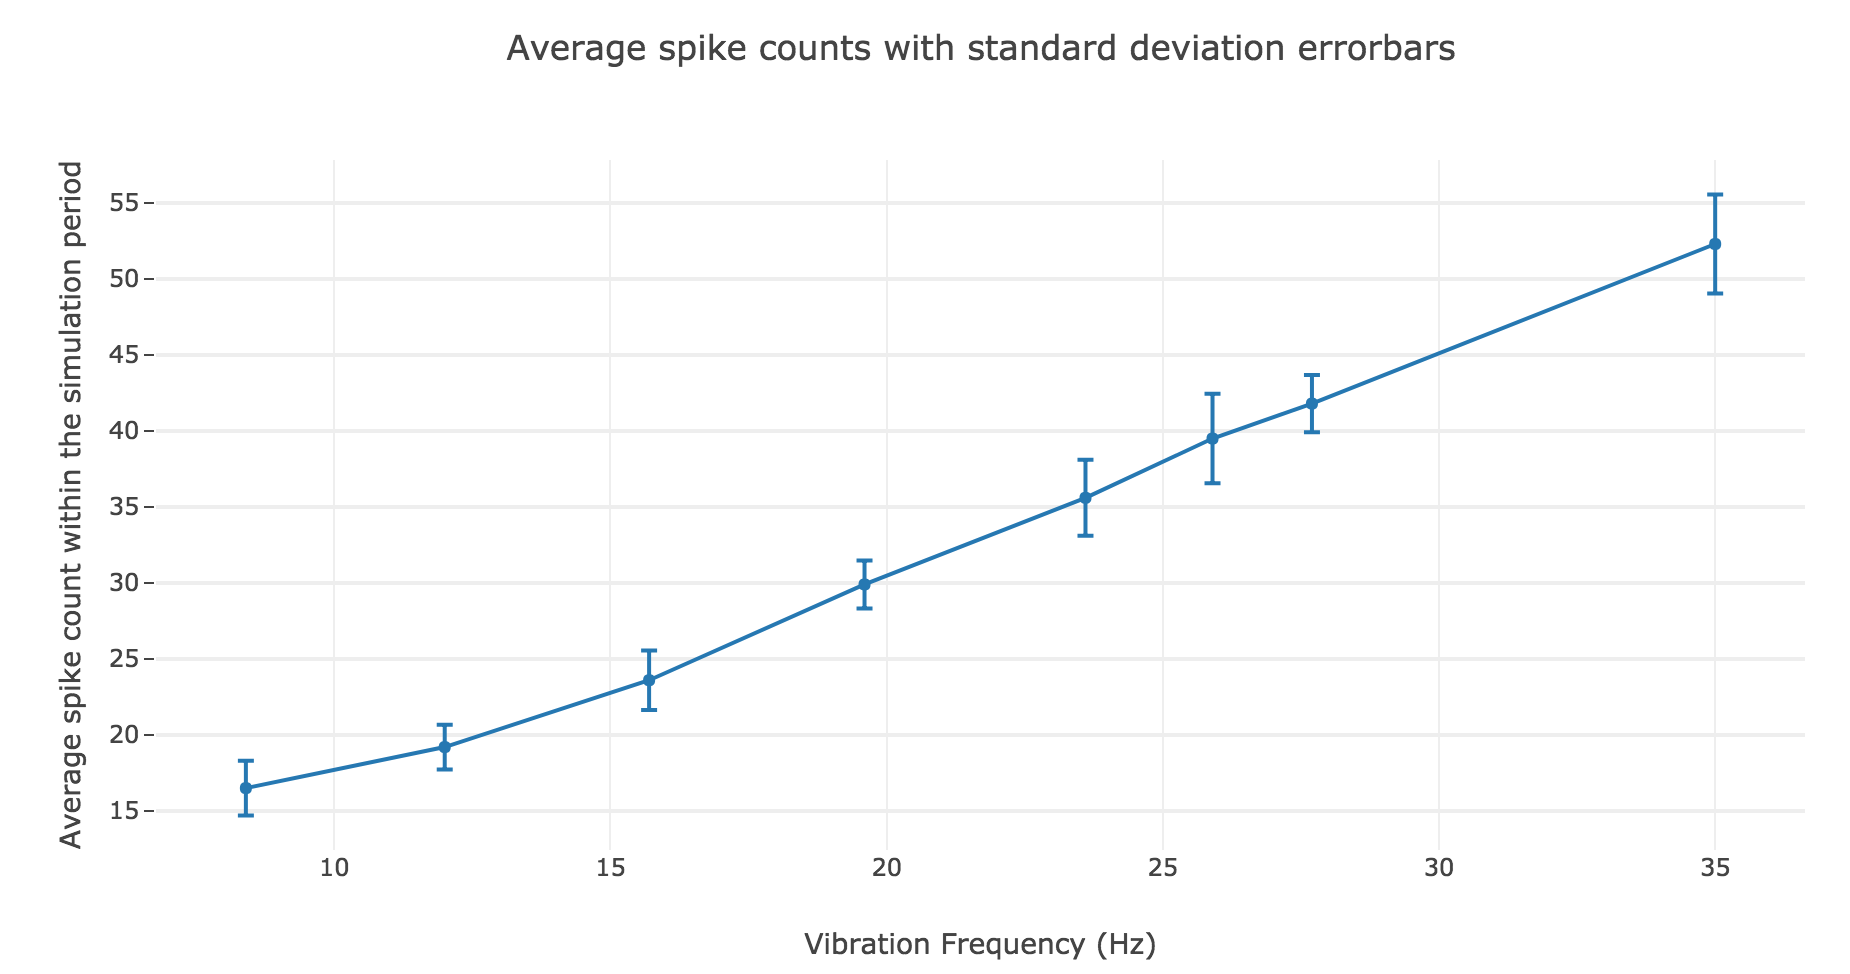
The latter observation is backed up by the shape of the average spike count, plotted as a function of the vibration frequency:

A linear regression of the average spike counts (as a function of the vibration frequency) can me made:
- Linear equation: \(y = 1.39 x + 3.08\)
- Correlation coefficient: $0.997$
- Standard error of the estimate: $0.04$
The very high correlation coefficient and very low standard error of the estimate highlight an almost perfect match!
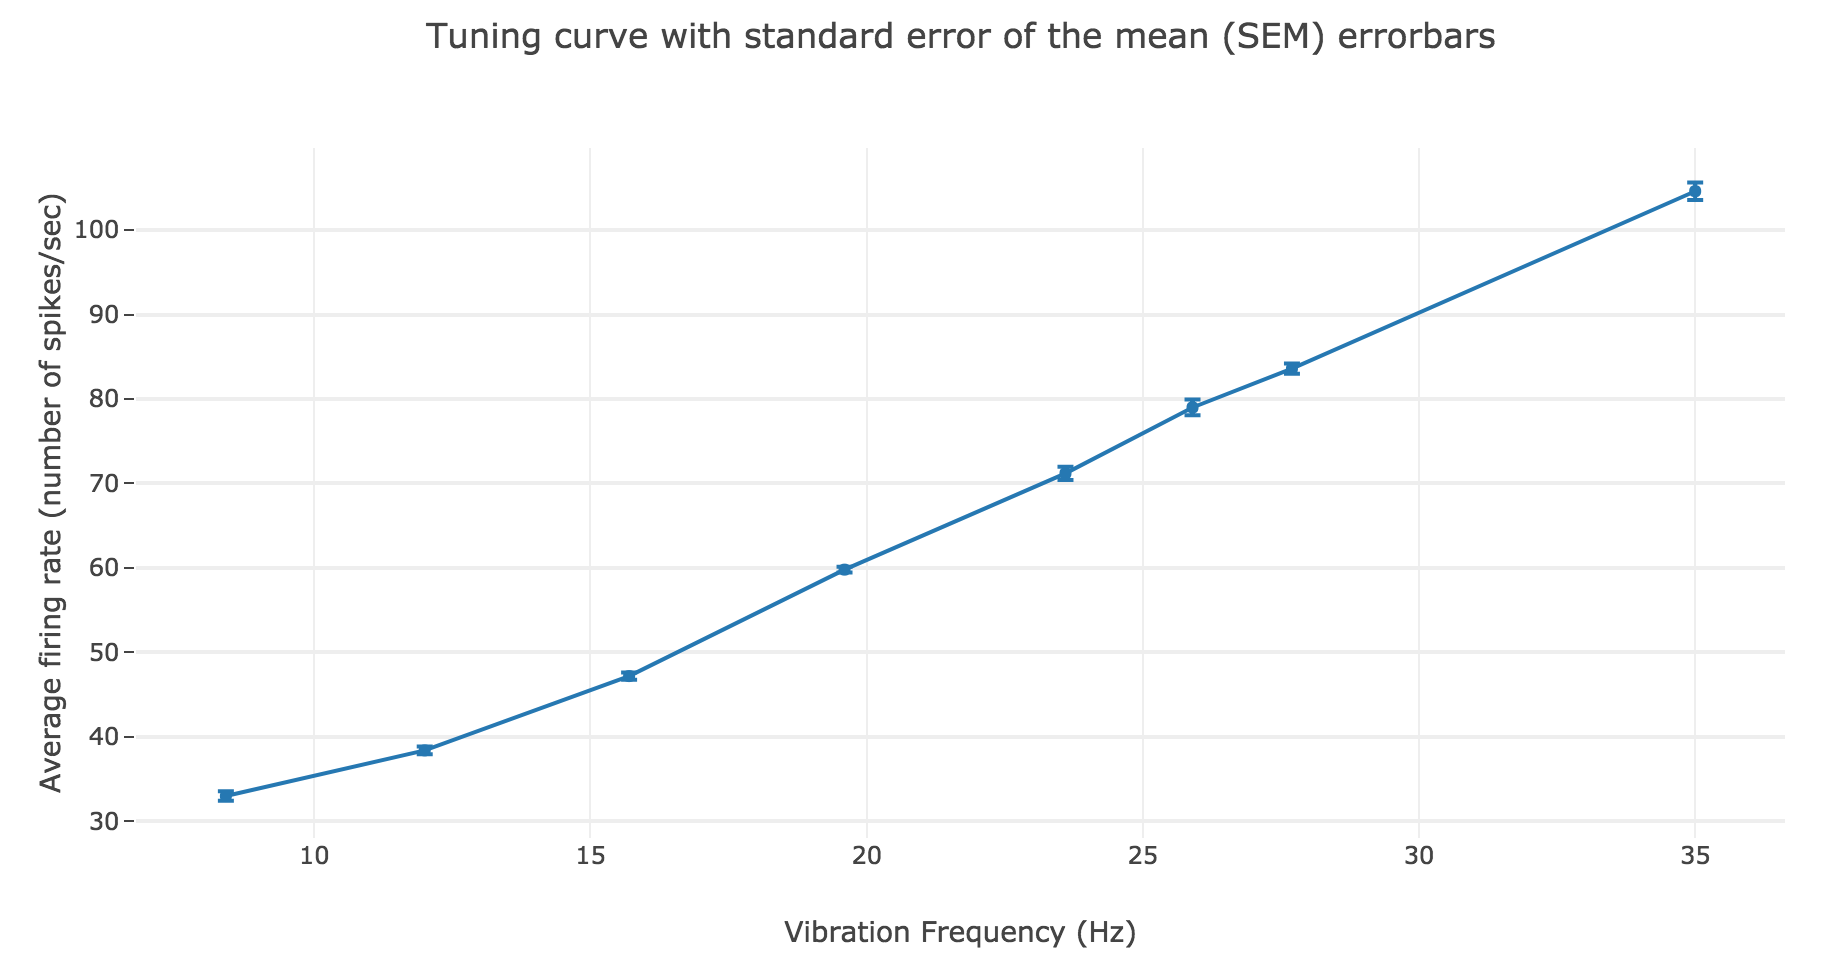
We have similar results for the average firing rate as a function of the vibration frequency:

The linear regression yields:
- Linear equation: \(y = 2.78 x + 6.15\)
- Correlation coefficient: $0.997$
- Standard error of the estimate: $0.08$
As a result: the firing rate of the neuron can be regarded as a non-decreasing linear function of the vibration frequency.
Leave a comment